Reducing soybean planting rates can increase income
Kevin Ganoe, Area Field Crop Specialist
Central New York Dairy and Field Crops
Results from 40 on-farm replicated trials conducted in Michigan from 2015 to 2018 build a compelling case for reducing soybean planting rates.
Michigan soybean producers have consistently identified planting rates as the highest priority topic to evaluate in on-farm replicated trials. Furthermore, the producers wanted to evaluate the effect of low planting rates on soybean yield and income. The two factors driving the increased interest in reducing soybean planting rates are seed cost and white mold. To help Michigan soybean producers make planting rate decisions, the SMaRT (Soybean Management and Research Technologies) program conducted a total of 40 on-farm replicated trials from 2015 to 2018.
Eleven planting rate trials were conducted each year from 2015 to 2017 and seven trials were conducted in 2018. Four target planting rates (80,00, 100,000, 130,000, and 160,000 seeds per acre) were compared at all but one location where the lowest rate was not included. Stand counts were taken to determine actual final plant stands at each location in all years. To calculate the income (gross income - seed cost) generated by each planting rate, we used the USDA projected prices and average seed costs for treated seed for each year. None of the varieties planted in the trials were straight line or thin line plant type and a complete seed treatment was used at 33 of the locations.
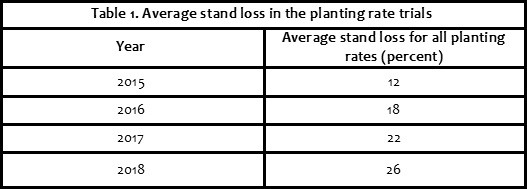
Because we conducted the trials over four years, we learned how the planting rates performed over a range of growing conditions. Planting conditions were nearly ideal in 2015 but were much more challenging in 2016, 2017 and 2018 as evidenced by the average stand loss shown in Table 1. Statewide record yields were achieved in 2015 and again in 2016. However, yields declined significantly in 2017 due to excessive early rains and a lack of rain in August and September. Yields rebounded in 2018.
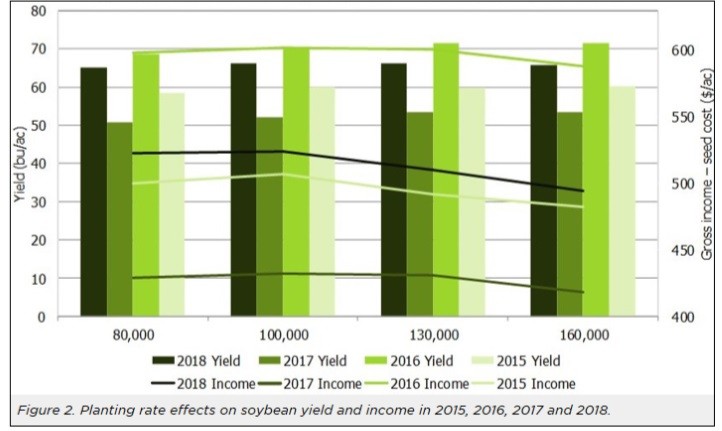
The effects of soybean planting rates on yield and income are shown in Figure 2. The bars represent yield and the lines represent income. The figure clearly shows the year-to-year variability in yield and income. It also shows that the lowest two planting rates were the most profitable in 2015 and 2018 and the highest planting rate was the least profitable each year. Table 2 shows the average yield and income for all 40 locations.

*Using 2018 figures for seed cost ($63/140,000 seed unit) and market price ($8.60 per bushel).
When all 40 sites were combined, the yields from the highest two planting rates were identical and they beat the 100,000 seeds per acre planting rate by less than one bushel per acre and the 80,000 rate by only 2.2 bushels per acre. The 100,000 seeds per acre planting rate generated the most income.
Two of the trials were infested with white mold showing that reducing soybean planting rates can also be an effective management practice for reducing yield and income losses from white mold (Table 3). At both sites, the lowest planting rate produced $80 per acre more income than the highest planting rate.

*Using 2018 figures for seed cost ($63/140,000 seed unit) and market price ($8.60 per bushel)
Half of the planting rate trials were conducted in Tuscola and Sanilac counties, so the Thumb area has been well represented. However, we are looking for sites in mid-Michigan, southwest Michigan and southeast Michigan for 2019. This trial is very easy to conduct when the planter is equipped with electric or hydraulic variable rate drives.
This article was originally published in the Spring 2019 issue of the Michigan Soybean News, Volume 11, Issue 2.
Upcoming Events
New York State Fiber Conference
June 9, 2024
Bouckville, NY
Theme for this year: Quality Matters
Announcements
Cash Rent and Custom Harvest Survey
To date, there is limited information available about rental rates and fees for crop harvesting. Farms can use this valuable information for their farm business planning to help improve decision making and profitability.Farmers Can Join MeatSuite For Free!
MeatSuite.com is a free resource provided by Cornell University where NY meat farmers can create a farm profile and list their bulk (wholes, halves, quarters) and bundled (i.e. Grilling Bundle) meat products.Why should farmers join?
1. It's free and easy!
2. Connect with more local customers. In the past year the MeatSuite.com farm directory had 8,300 visits from New York consumers. Farm profiles get as many as 25 views per month from potential local customers. We also spotlight MeatSuite farms on social media and bring attention and purchases to farms through highlights and giveaways.
How do I join?
Farmers can visit https://www.meatsuite.com/farmers/ to create a free farm profile. You must list at least one product for your farm's profile to go live. You'll also have access to Cornell's free Meat Price Calculator, a helpful tool for pricing your meat to make a profit.
While you're on MeatSuite, check out the "Creating Consumer-Friendly Bulk Meats" publication on the log-in page. It has tips on how to create bulk meat products that are easier for first-time buyers to say "yes" to.
If you have any questions as you create your farm profile or products, we're here to help! Please email Matt LeRoux at mnl28@cornell.edu.

